|
Page 6 |
MICROBIOLOGY LAB MANUAL |
| LAB INDEX | Page 5 |
LAB 3
Bacteria Enumeration
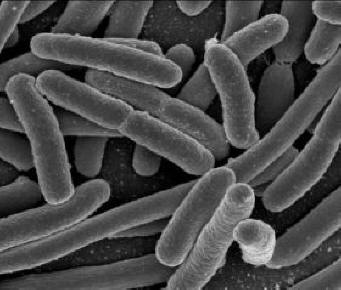
Individual bacteria in a colony
1) Introduction
2) Viable Plate Count
3) Direct Count
4) Turbidity Count
5) Questions
Tables / Graphs
Table 1 Viable Plate Count
Table 2 Direct Count
Table 3 Turbidity Count
Questions
Cover Page
1) INTRODUCTION
| As part of daily routine, the laboratory microbiologist often has to determine the number of bacteria in a given sample as well as having to compare the amount of bacterial growth under various conditions. Enumeration of microorganisms is especially important in dairy microbiology, food microbiology, and water microbiology. Knowing the bacterial count in drinking water, fresh milk, buttermilk, yogurt, can be useful in many aspects of industrial microbiology. Bacteria are so small and numerous, counting them directly can be very difficult. Some of the methods used involve diluting the sample to a point at which the number of bacteria has been reduced to very small numbers. This enables an estimate to be established for quantifying the bacteria. Direct counts of bacteria require a dye to be introduced to the populations of bacteria to allow the observer to view the bacteria. |
|
2) VIABLE (STANDARD) PLATE COUNT
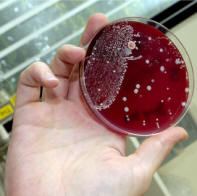
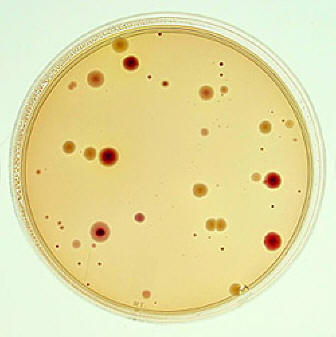
Viable Plate Count (also called a Standard Plate Count) is one of the most common methods, for enumeration of bacteria. Serial dilutions of bacteria are plated onto an agar plate. Dilution procedure influences overall counting process. The suspension is spread over the surface of growth medium. The plates are incubated so that colonies are formed. Multiplication of a bacterium on solid media results in the formation of a macroscopic colony visible to naked eye. It is assumed that each colony arises from an individual viable cell. Total number of colonies is counted and this number multiplied by the dilution factor to find out concentration of cells in the original sample. Counting plates should have 30-300 colonies at least. Since the enumeration of microorganisms involves the use of extremely small dilutions and extremely large numbers of cells, scientific notation is routinely used in calculations.
A major limitation in this method is selectivity. The nature of the growth medium and the incubation conditions determine which bacteria can grow and thus be counted. Viable counting measures only those cells that are capable of growth on the given medium under the set of conditions used for incubation. Sometimes cells are viable but non-culturable.
The number of bacteria in
a given sample is usually too great to be counted directly. However, if
the sample is serially diluted and then plated out on an agar surface in
such a manner that single isolated bacteria form visible isolated
colonies, the number of colonies can be used as a measure of the number
of viable (living) cells in that known dilution. The viable plate count
method is an indirect measurement of cell density and reveals
information related only to live bacteria.
|
Normally, the bacterial sample is diluted by factors of 10 and
plated on agar. After incubation, the number of colonies on a
dilution plate showing between 30 and 300 colonies is
determined. A plate having 30-300 colonies is chosen because
this range is considered statistically significant. If there are
less than 30 colonies on the plate, small errors in dilution
technique or the presence of a few contaminants will have a
drastic effect on the final count. Likewise, if there are more
than 300 colonies on the plate, there will be poor isolation and
colonies will have grown together. Generally, one wants to determine the number of (colony forming units) CFUs per milliliter (ml) of sample. To find this, the number of colonies (on a plate having 30-300 colonies) is multiplied by the number of times the original ml of bacteria was diluted (the dilution factor of the plate counted). For example, if a plate containing a 1/1,000,000 dilution of the original ml of sample shows 150 colonies, then 150 represents 1/1,000,000 the number of CFUs present in the original ml. Therefore the number of CFUs per ml in the original sample is found by multiplying 150 x 1,000,000 as shown in the formula below: |
|
CFUs per ml of sample = The number of colonies counted X The dilution factor of the plate counted
In the case of the example above, 150 x 1,000,000 = 150,000,000 CFUs per ml.
At the end of the incubation period, select all of the agar plates containing between 30 and 300 colonies. Plates with more than 300 colonies cannot be counted and are designated "too numerous to count" (TNTC). Plates with fewer than 30 colonies are designated "too few to count" (TFTC).
|
VIRTUAL LAB |
We will be testing four samples of water for the Viable Count. The samples include:
1) water from a drinking fountain
2) boiled water from a drinking fountain
3) water from the local river
4) boiled water from the local river
You will need DATA TABLE 1 to input your data and calculate the number of CFU per ml.
Link for Virtual Lab
PROCEDURE
1)
Take 6 dilution tubes, each containing 9 ml of sterile saline.
2) Dilute 1 ml of a sample by withdrawing 1 ml of the sample and
dispensing this 1 ml into the first dilution tube.
3) Using the same procedure, withdraw 1 ml from the first
dilution tube and dispense into the second dilution tube. Subsequently
withdraw 1 ml from the second dilution tube and dispense into the third
dilution tube. Continue doing this from tube to tube until the dilution
is completed.
Figure 3.3 Serial dilution
4)
Transfer 1 ml from each of only the last three dilution tubes onto the
surface of the corresponding agar plates.
5)
Incubate the agar plates at 37°C for 48 hours.
6)
Choose a plate that appears to have between 30 and 300 colonies.
Figure 3.4 Enumerating a serial
dilution
7) Count the exact
number of colonies on that plate
8) Calculate the number of CFUs per ml of original sample as
follows:
CFUs per ml of sample = The number of colonies X The dilution factor of the plate counted
Figure 3.5 Analyzing a serial
dilution
|
Data Table 1 |
||||
|
Sample |
Dilution Factor |
# of Colonies |
Dilution Factor X # of Colonies |
# of CFU / ml |
|
Faucet Water |
|
|
|
|
|
River Water |
|
|
|
|
|
Boiled Faucet Water |
|
|
|
|
|
Boiled River Water |
|
|
|
|
|
CFUs per ml of sample = The # of colonies counted X The dilution factor of the plate counted |
||||
Figure 3.6 Data Table 1
3) DIRECT MICROSCOPIC CELL COUNT
In the direct microscopic count, a counting chamber with a ruled slide is employed. It is constructed in such a manner that the ruled lines define a known volume. The number of bacteria in a small known volume is directly counted microscopically and the number of bacteria in the larger original sample is determined by extrapolation.
| The Petroff-Hausser counting chamber for example, has small etched squares 1/20 of a millimeter (mm) by 1/20 of a mm and is 1/50 of a mm deep. The volume of one small square therefore is 1/20,000 of a cubic mm or 1/20,000,000 of a cubic centimeter (cc). There are 16 small squares in the large double-lined squares that are actually counted, making the volume of a large double-lined square 1/1,250,000 cc. The normal procedure is to count the number of bacteria in five large double-lined squares and divide by five to get the average number of bacteria per large square. This number is then multiplied by 1,250,000 since the square holds a volume of 1/1,250,000 cc, to find the total number of organisms per ml in the original sample. |
|

Figure 3.8 Counting chamber graphic
If the bacteria are diluted, such as by mixing the bacteria with dye before being placed in the counting chamber, then this dilution must also be considered in the final calculations.
The formula used for the direct microscopic count is:
#
bacteria per cc (ml)
=
The # of bacteria per large double-lined square
X
The dilution factor of the large square (1,250,000)
X
The dilution factor (dye)
|
VIRTUAL LAB |
We will be testing four samples of water for the Direct Microscopic Count. The samples include:
1) water from a drinking fountain
2) boiled water from a drinking fountain
3) water from the local river
4) boiled water from the local river
You will need DATA TABLE 2 to input your data and calculate the number of bacteria per ml.
Link for Virtual Lab
PROCEDURE
1) Add 1 ml of the
sample into a tube containing 1 ml of the dye methylene blue. This gives
a 1/2 dilution of the sample.
2) Fill the chamber of a Petroff-Hausser counting chamber with
this 1/2 dilution.
3) Place the chamber on a microscope and focus on the squares
using 400X.
4) Count the number of bacteria in one of the large double-lined
squares. Count all organisms that are on or within the lines.
5) Calculate the number of bacteria per cc (ml) as follows:
The number of bacteria per cc (ml)
=
The number of bacteria per large square
X
The dilution
factor of the large
square (1,250,000)
X
The dilution
factor of any
dilutions made prior to placing the sample
in the counting chamber, such as mixing it with dye (2 in this case)
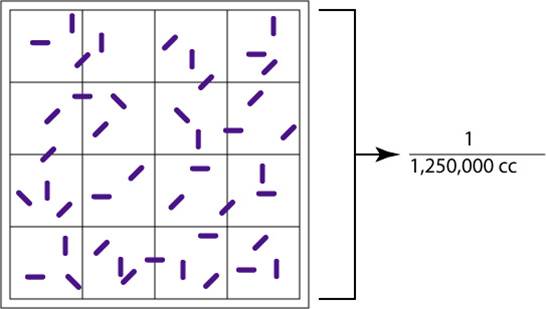
Figure 3.9 Counting Square
The large, double-lined square holds a volume of 1/1,250,000 of a cubic centimeter. Using a microscope, the bacteria in the large square are counted. Count all organisms that are on or within the darker double lines.
|
Data Table 2 |
|||||
|
Sample |
# of Bacteria |
Dilution
Factor |
Dilution |
DF (large
square) X |
# of |
|
Faucet Water |
|
1,250,000 |
2 |
1,250,000 X 2 X ______ |
|
|
River Water |
|
1,250,000 |
2 |
1,250,000 X 2 X ______ |
|
|
Boiled Faucet Water |
|
1,250,000 |
2 |
1,250,000 X 2 X ______ |
|
|
Boiled River Water |
|
1,250,000 |
2 |
1,250,000 X 2 X ______ |
|
|
# bacteria per ml = # of bacteria in square X dilution factor (Large Square) (1,250,000) X dilution factor (dye) |
|||||
Figure 3.10
Data Table 2
4) TURBIDITY COUNT
When you mix the bacteria growing in a liquid medium, the culture appears turbid. This is because a bacterial culture acts as a colloidal suspension that blocks and reflects light passing through the culture. Within limits, the light absorbed by the bacterial suspension will be directly proportional to the concentration of cells in the culture. By measuring the amount of light absorbed by a bacterial suspension, one can estimate and compare the number of bacteria present. Spectrophotometric analysis is based on turbidity and indirectly measures all bacteria (cell biomass), dead and alive.
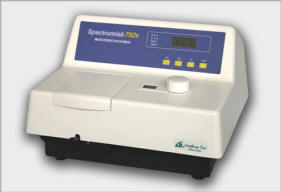
| The
instrument used to measure turbidity is a spectrophotometer. It
consists of a light source, a filter which allows only a single
wavelength of light to pass through, the sample tube containing
the bacterial suspension, and a photocell that compares the
amount of light coming through the tube with the total light
entering the tube.
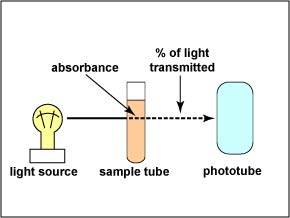
The ability of the culture to block the light can be expressed as the amount of light absorbed in the tube. The absorbance (or optical density) is directly proportional to the cell concentration. (The greater the absorbance, the greater the number of bacteria.) Light entering a cloudy solution will be absorbed. A clear solution will allow almost all of the light through. |
|
The amount of absorbance measures what fraction of the light passes through a given solution and indicates on the absorbance display the amount of light absorbed compared to that absorbed by a clear solution.
|
Inside, a
light shines through a filter (which can be adjusted by
controlling the wavelength of light), then through the sample
and onto a light-sensitive phototube. This produces an
electrical current. The absorbance meter measures how much light
has been blocked by the sample and thereby prevented from
striking the phototube. A clear tube of water or other clear
solution is the BLANK and has zero absorbance. The amount of
substance in the solution is directly proportional to the
absorbance reading. A graph of absorbance vs. concentration will
produce a straight line.
As the number of bacteria in a broth culture increases, the
absorbance increases.
|
|
A standard curve comparing absorbance to the number of bacteria can be made by plotting absorbance versus the number of bacteria per ml. Once the standard curve is completed, any dilution tube of that organism can be placed in a spectrophotometer and its absorbance read. Once the absorbance is determined, the standard curve can be used to determine the corresponding number of bacteria per ml.
|
VIRTUAL LAB |
We will be testing only two samples of water for the turbidity enumeration test. One of the samples has been drawn from a drinking water faucet while the other was taken from the local river. You will need DATA TABLE 3 and a printable version of the STANDARD CURVE CHART to enumerate your samples bacteria.
Link for Virtual Lab
|
PROCEDURE 2) Use four of these tubes (tubes 2 to 5) of broth to make four serial dilutions of the culture. 3) Transfer 5ml of the ORIGINAL sample to the first broth tube. Transfer 5ml from that tube to the next tube, and so on until the last of the four tubes has 5ml added to it. These tubes will be 1/2, 1/4, 1/8, and 1/16 dilutions. |
|
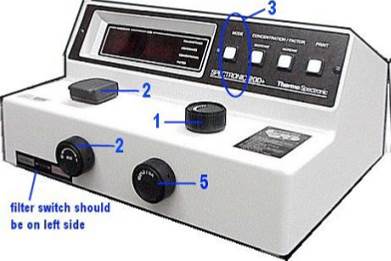
|
4) Set the display mode on the Spectrophotometer to ABSORBANCE by pressing the MODE control key until the appropriate red LED is lit. 5) Set the wavelength to 520 nm by using the WAVELENGTH dial. 6) Standardize the spectrophotometer by using a BLANK. The BLANK used to standardize the machine is sterile nutrient broth: it is called the BLANK because it has a sample concentration equal to zero (# of bacteria = 0). 7) Place the original bacterial specimen into the spectrophotometer. 8) Next insert the 1/2 dilution and read it. Repeat this with the 1/4, 1/8, and 1/16 dilutions. Read to the nearest thousandth (0.001) on the absorbance digital display.
|
|
9) Record your values in TABLE 3 for each of the individual samples, along with the dilutions that they came from.
10) Using the standard curve table given below, calculate the number of bacteria per milliliter for each dilution.
**Review the example of absorbance counts acquired and the determinations of # of bacteria for the dilutions using the STANDARD CURVE CHART given below. Be sure to keep track of all of the zeros in your calculations of the subsequent calculations for average bacteria per ml.
|
|||||||||||||||||||||||||||||||||||||||||||||||||||||||
STANDARD CURVE CHART (MS WORD)
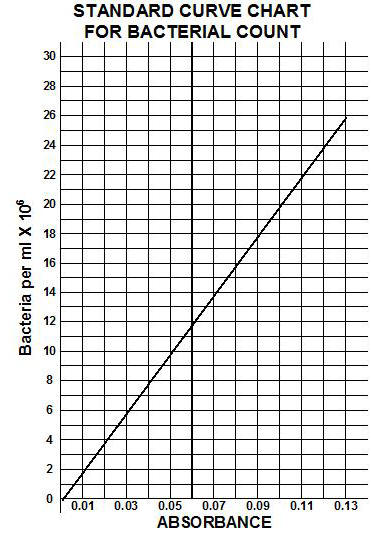
Figure 3.16 Standard curve
QUESTIONS
5) QUESTIONS
1) State the formula for determining the number of CFUs per ml of sample when using the plate count technique.
2) State the formula for determining the number of bacteria per ml of sample when using the direct microscopic method of enumeration.
3) State the relationship between absorbance and the number of bacteria in a broth sample.
4) Which method of determining bacterial numbers do you feel is the most accurate and why?
5) Which method of determining bacterial numbers do you feel is the least accurate and why?
END LAB 3
| LAB INDEX | Page 5 |